All-In-One Scriptless Test Automation Solution!
Off-the-Shelf Inventory Software Vs Customized Self-Serve Inventory Analytics – What Suits You Best?
Given a choice, inventory planners would want to custom-design self-serving analytics built around their tools in daily use and ways of working. However, most businesses are completely unaware of No-Code solutions that can empower non-technical employees and teams to automate workflows that make it easy to track inventory KPIs.
Given the fact that most inventory planners are non-technical business users, the objectives they set to achieve through ‘Agile Demand Planning’ or ‘Data-Driven Demand Planning’ vastly vary from one another. Hence, in such a scenario, a modular approach to build self-serving inventory automation and analytics becomes a more viable alternative as compared to off-the-shelf SaaS software with high licencing costs and fixed features that may not fulfil the inventory team’s very specific requirements.
For example, you may be a manufacturer who needs to perform complex revenue calculations which require a sync with the pricing sheet of the SKUs. Also, you may need to compute varying supplier and input costs to arrive at any cash flow conclusions. You could also be a business that has already introduced Quickbooks as well as a NetSuite to streamline order management and invoicing tasks. But, despite your best efforts, manual tasks such as collating data from multiple spreadsheets, attachments, chats, etc., still persist
However, when the business scales from 1 manufacturing unit to 7 or when you start to involve multiple vendors/suppliers, logistics partners, distribution warehouse networks, etc., the legacy system untenable.
Find Answers to Some Key Questions
How can inventory planners use APIs to build inventory analytics dashboards?
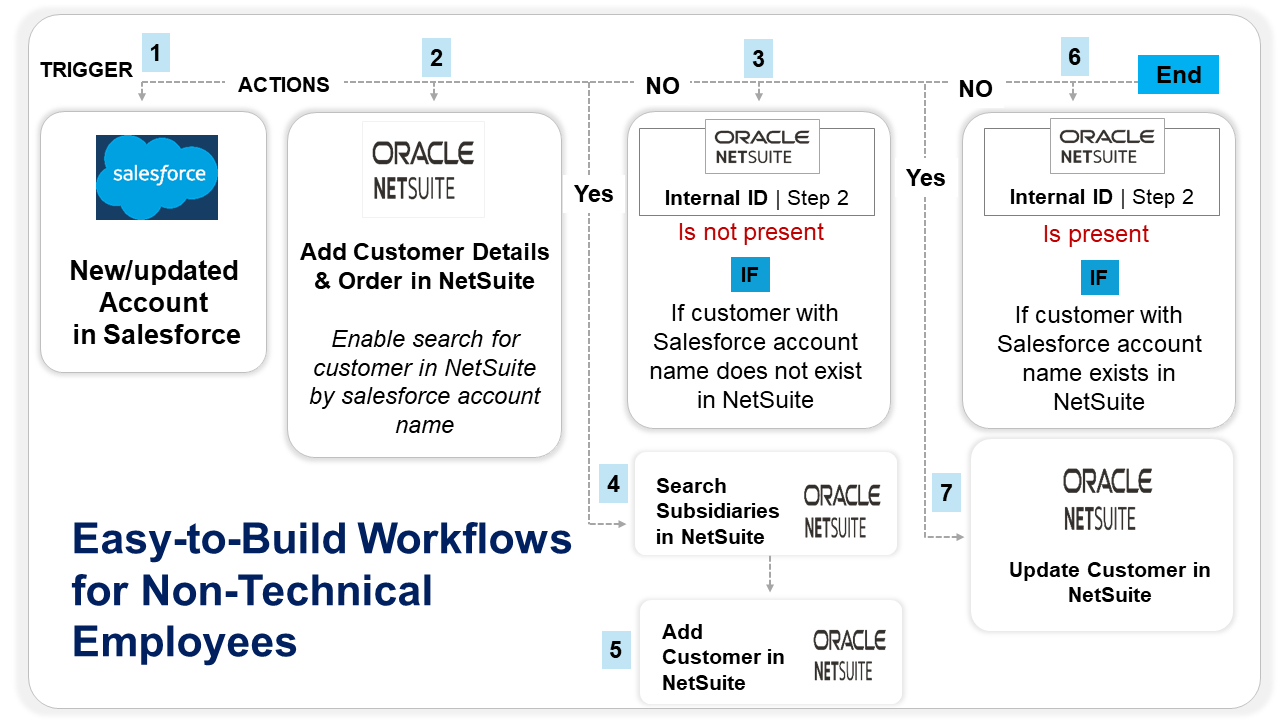
How can non-technical employees use No-Code for building automated inventory management workflows?
What type of inventory KPIs can be tracked using API integrations?
How can event-driven architecture automate inventory planning tasks?
It is not an easy choice to make, especially when there are so many off-the-shelf software options to solve demand forecasting problems. What business leaders however fail to assess is how these new tools and platforms work with their legacy systems and databases. Not all new-age, cloud-based products come with the leverage of integrations with legacy databases.
Hence, the most sensible thing to do in such a situation is to assess areas where business users or employees can themselves execute small automation integration projects first. When API integrations are easy to deploy and do not require technical expertise, it can become the first logical step towards Inventory Tracking Automation. Functional teams such as Sales, FP&A, Inventory, Production, etc., can thereafter create self-serving analytics reports using our event-driven supplychain automation expertise.
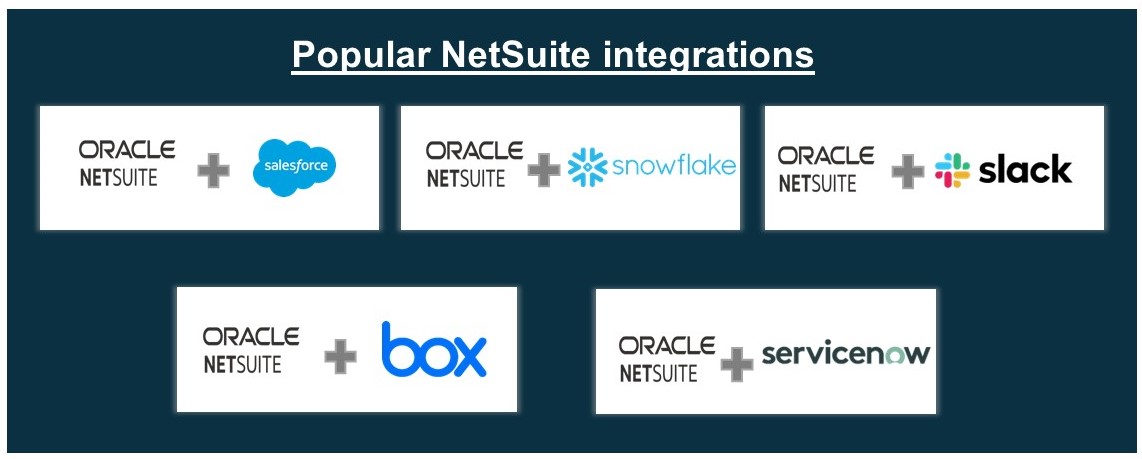
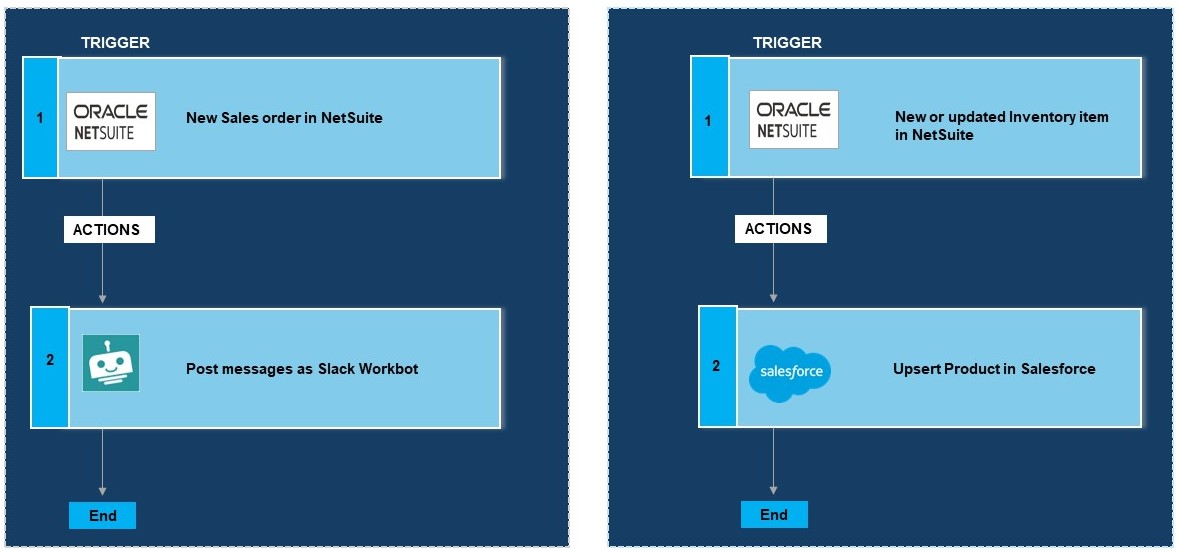
Popular Workflows You Can Build Using Our No-Code Integrations
These Simple No-Code Integrations Can Automate all Manual Inventory Data Extraction and Data Input Tasks:
A retail company sells various products through multiple channels (online, brick-and-mortar stores) and needs to optimize its inventory levels to meet customer demand while minimizing stockouts and excess inventory.
Data Integration and Event Ingestion
Various data sources such as point-of-sale (POS) systems, online sales platforms, inventory management systems, and supply chain databases are integrated into a centralized event streaming platform (e.g., Apache Kafka).
Events are ingested in real-time as they occur, including sales transactions, inventory updates, shipments received, and forecasts from demand planning systems.
Event Processing and Analysis
Incoming events are processed and analyzed in real-time using stream processing frameworks (e.g., Apache Flink, Apache Spark Streaming).
Demand patterns, sales trends, and inventory levels are continuously monitored and analyzed to identify anomalies, predict future demand, and detect inventory shortages or surpluses.
Inventory Optimization and Decision-Making
Advanced analytics and machine learning models are applied to historical sales data, seasonality patterns, promotions, and external factors (e.g., weather, holidays) to forecast future demand for each product SKU.
Inventory optimization algorithms calculate optimal reorder points, safety stock levels, and replenishment quantities based on demand forecasts, lead times, service level targets, and cost constraints.
Event-Triggered Actions
When certain predefined events occur (e.g., low stock alert, unexpected surge in demand, supplier delay), event-driven rules and workflows are triggered automatically.
For example, when inventory levels for a particular SKU fall below the reorder point, a purchase order is automatically generated and sent to the supplier.
Alternatively, if demand for a specific product SKU exceeds forecasted levels, automated actions such as expedited shipping or reallocating inventory from other locations are triggered to fulfill customer orders.
Real-Time Visibility and Monitoring
Inventory planners and supply chain managers have real-time visibility into inventory levels, demand forecasts, order statuses, and supply chain events through interactive dashboards and alerts.
Key performance indicators (KPIs) such as fill rate, stockout rate, inventory turnover, and order cycle time are continuously monitored to assess performance and identify areas for improvement.
Real-Time Responsiveness
Enables proactive inventory management and rapid response to changing demand patterns, supply disruptions, and market conditions.
Optimized Inventory Levels
Reduces excess inventory, stockouts, and carrying costs while improving service levels and customer satisfaction.
Automated Decision-Making
Streamlines decision-making processes and reduces manual intervention by automating routine tasks and workflows.
Improved Forecast Accuracy
Enhances demand forecasting accuracy through real-time data analysis and machine learning algorithms, leading to better inventory planning decisions.
End-to-End Visibility
Provides end-to-end visibility into the supply chain, enabling stakeholders to make informed decisions and collaborate effectively across functions.
By leveraging event-driven data architecture, the retail company can achieve agile and efficient inventory planning, ensuring the right products are available at the right time and in the right quantities to meet customer demand while optimizing inventory costs and operational efficiency.
Download this EBook to know how the top retail and logistics companies are leveraging automation use cases to improve Demand Planning & Forecasting.
Qualify for a free consultation on the right application modernization strategy for your enterprise.